
A capability figure can look reassuring while leaving the important purchasing questions unanswered. Which diameter was measured? Were the parts made before or after grinding? Does the data include several production periods, or only a short run after an adjustment? Before comparing Cpk or Ppk, establish what the report actually represents.
This guide is for buyers reviewing evidence for precision shafts, pins and custom turned parts. It supplies a report-review checklist, not a capability claim for MICRO or a universal approval threshold.
What Cpk and Ppk mean in the stated analysis
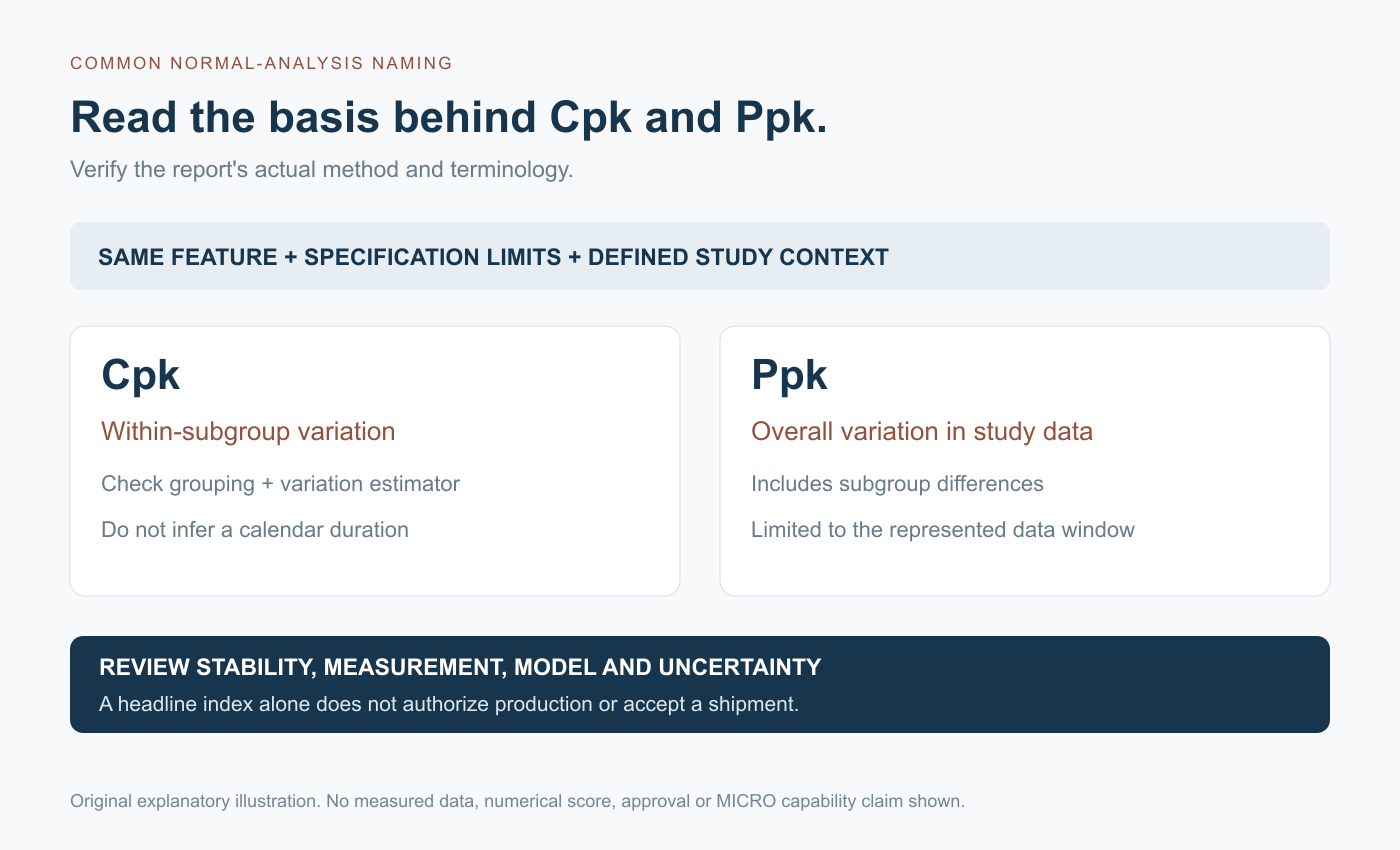
Under the common normal-analysis, Six Sigma naming convention, Cpk uses an estimate of within-subgroup variation, while Ppk uses overall variation in the study data. Both also reflect the process mean's position relative to the specification limit or limits used. The distinction concerns the calculation basis, not simply the number of days printed on the report.
Minitab's comparison of within and overall capability explains that overall variation includes differences between subgroups, whereas within capability excludes those differences. Confirm the analysis method, variation estimator and the output's naming convention. Different reporting frameworks or software settings can use different labels; letters alone do not establish a comparable study.
Read the characteristic and specification first
Find the drawing revision, characteristic identifier, units, finished condition and applicable specification limits. A result for a turned diameter cannot automatically support the same diameter after treatment or grinding. A result for one journal also does not establish capability for another feature or every product in a catalogue.
NIST describes process capability as comparing a stable process's output with its specification limits. Keep those limits separate from control limits, which are used to assess process behavior. Do not substitute a convenient target range for the released drawing requirement.
If the characteristic has only one specification limit, identify it explicitly. Do not invent a lower or upper limit to make a familiar two-sided report available. Ask the technical owner to confirm the applicable analysis for that requirement.
Ask how the observations were collected
The report should identify the production dates or sequence, sample count, subgroup arrangement and conditions represented. Keep the connection to actual parts, machines or routes where those are relevant to the agreed study. State whether the data covers setup, an initial trial, routine production or a specifically defined period.
Consecutive pieces taken together may form a subgroup under an agreed design, but grouping must have a technical basis. Do not rearrange time-ordered observations after seeing the results merely to improve the index. If multiple machines, tools or processing stages are combined, ask how that decision affects the interpretation rather than treating a pooled score as each source's individual capability.
Use this capability-report review checklist
Agree the required evidence with the supplier before the study. The following questions are an original purchasing checklist, not a statistical test or an authorization to release parts.
| Report item | Evidence to request | Question before accepting the interpretation |
|---|---|---|
| Characteristic | Drawing revision, feature, units and finished stage | Does this match the ordered requirement? |
| Specifications | Applicable upper and/or lower limits | Are the correct limits used, without invented boundaries? |
| Data window | Dates, sequence, quantity and production conditions | Which conditions does the study actually represent? |
| Grouping | Subgroup identity, size and collection rationale | Is variation being estimated on the intended basis? |
| Measurement | Method, equipment and relevant measurement-system evidence | Is the measurement suitable for this task? |
| Process behavior | Time-ordered results and stability assessment | Are shifts, trends or other changes unresolved? |
| Calculation | Method, distribution, estimator, software and uncertainty statement | Are the assumptions and reported labels clear? |
| Decision | Agreed criterion, scope, reviewer and open actions | What is authorized, and what remains unproven? |
The inspection-report guide helps trace characteristic results to records. The gauge-selection guide addresses the measurement task; a calibration label alone does not answer every suitability question.
Review stability before making a forward-looking claim
NIST's stability guidance examines process behavior over time, including changes in location, variation and distribution. Review the time order and the appropriate charts, rather than relying on the appearance of one histogram.
A difference between within and overall results is a reason to investigate the data and conditions. It does not, by itself, identify a particular machine fault, prove tool wear or demonstrate deliberate reporting manipulation. Ask what changed and whether the explanation is supported by the production record.
An overall index can summarize the observed data, but calling it “long-term” does not make an unrepresentative collection predictive. If the process is unstable, state the limitation and the actions required before using the study to support future performance.
Check the method and the uncertainty of the estimate
The normal-model indices discussed by NIST rely on distribution assumptions. Do not apply that model automatically to every geometric or bounded characteristic. Ask the analyst to justify the selected distribution, transformation or alternative method and identify any excluded observations with their reasons.
A reported index is an estimate, not an exact property established by its displayed decimal places. Where required, agree the confidence bound or interval, confidence level and decision rule. Specify whether the criterion concerns a point estimate or a lower bound; do not switch between them after seeing the outcome. This guide does not prescribe a sample count or a minimum index for every application.
Compare two report scopes before comparing their scores
Consider a fictional shaft-report review, not a MICRO study. Report A covers a short run from one setup after final grinding. Report B combines several stated production periods and includes a different treatment stage. Even if both show an index beside the word “diameter,” their results are not automatically comparable.
The buyer should resolve the feature and finished-stage mismatch first, then review the data window, grouping and calculation method. Request a consistently scoped study where needed. Preserve the original reports and identify the unanswered questions; do not average their indices or select the more attractive number as proof of general supplier capability. No measured values or capability scores are supplied in this example.
Keep capability, sample approval and lot acceptance distinct
A sample-approval decision covers specified trial evidence. A lot-acceptance sampling decision concerns an identified shipment under its agreed plan. Neither automatically establishes stable production capability, and a capability report does not replace the required checks on a particular delivery.
For a MICRO inquiry, identify the characteristic, intended production stage and documentation needed for confirmation. The quality page describes the project-based discussion of Cpk analysis; it is not a blanket performance guarantee. Use the contact form and email drawings to [email protected] with the inquiry reference. Carry agreed evidence and open actions into the prototype-to-production handoff.